

Carbon Benchmarking
Know where you standwith sustainability.
Benchmark yourself against your competitors to know how you are really doing with your climate goals. See your performance in the context of your sector and the wider market, so every decision is grounded in reality, not guesswork.
Generate your benchmark report in minutes.


Try Periscope.eco
Try for FREE now.Get your benchmark report today.

Competitive clarity
Use climate data to your advantage.
Drive competition and change. Gain the competitive edge by making every decision with real-world carbon intelligence.
Ask the hard questions. Get easy answers.
How are we actually doing?
How do we compare?
What do these numbers really mean?
A clear view of your carbon performance in context.
Periscope.eco gives you a carbon health score tailored to your industry and a live view of how you compare with competitors across a number of key metrics. It's everything you need to be boardroom and tender ready, without building a data team.
Carbon health score
Tailored to your industry
Get a single, board-friendly score that reflects your emissions, intensity and energy consumption normalised for your sector and size. No more unfair comparisons.
Benchmarking
See how you really compare
Compare your performance within and outside your industry across key metrics like emissions intensity and reduction pace. Instantly see if you're ahead of, in line with, or behind your competitors.
Carbon reporting
Easy meaningful reporting
Generate interactive carbon reports at the click of a button. Share the link with stakeholders or customers to showcase your climate performance.
Boardroom & tenders
Be boardroom and tender ready
Turn complex data into clear, confident stories your board can act on. One clear picture to prove your climate performance and win more work.
Market trends
View historic trends across the market
Track how your sector is moving over time and overlay your own trajectory. See whether you're closing the gap or being overtaken, and adjust your strategy before it shows up in annual reports.
Commercial impact
Built for bids, audits and renewals
Drop Periscope.eco outputs straight into tender responses, supplier questionnaires and investor DD. Answer climate and ESG questions with hard numbers, benchmarks and clear visuals.
Shareable reporting
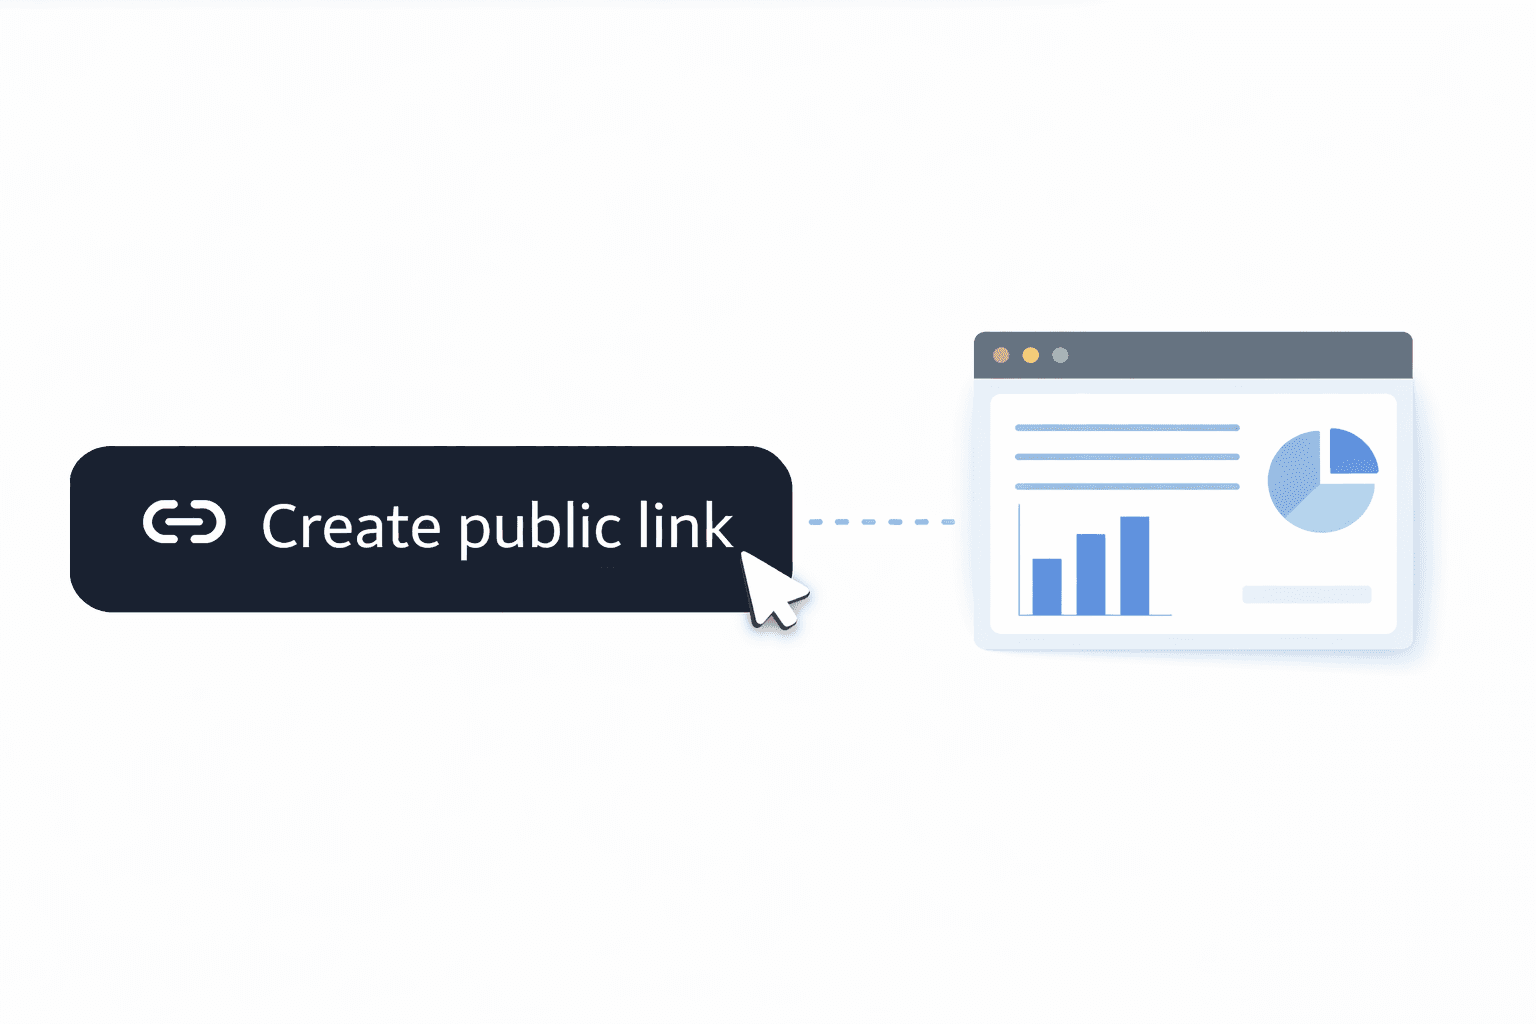
Share interactive reports, not slide decks.
With just one click, you can share your carbon report with stakeholders and customers.
See your performance in living colour.
Periscope.eco turns complex carbon data into clear, visual stories.
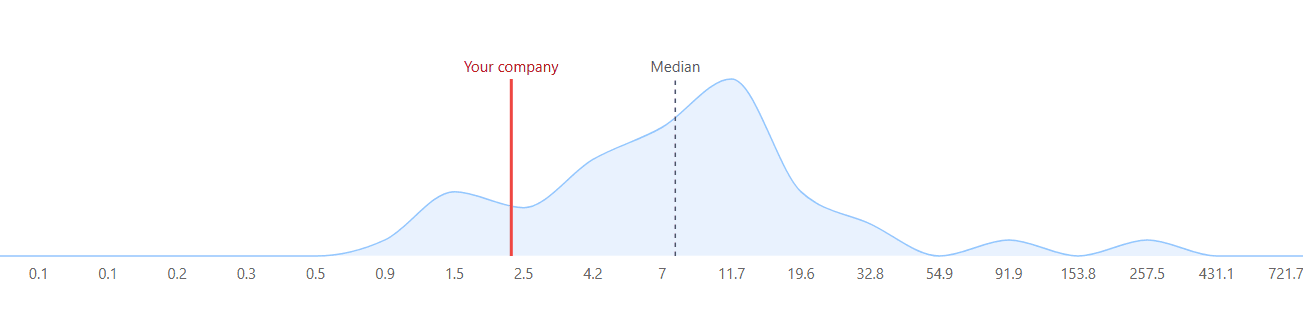
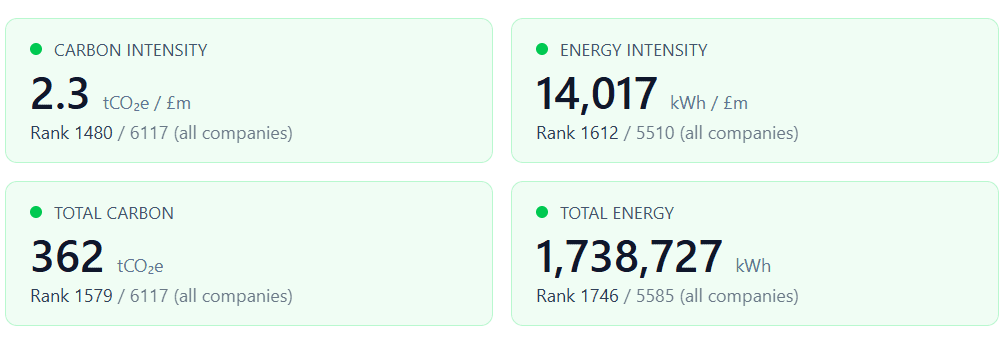
Carbon health at a glance
Average emissions vs the market
See how your overall emissions intensity compares with the average in your sector.
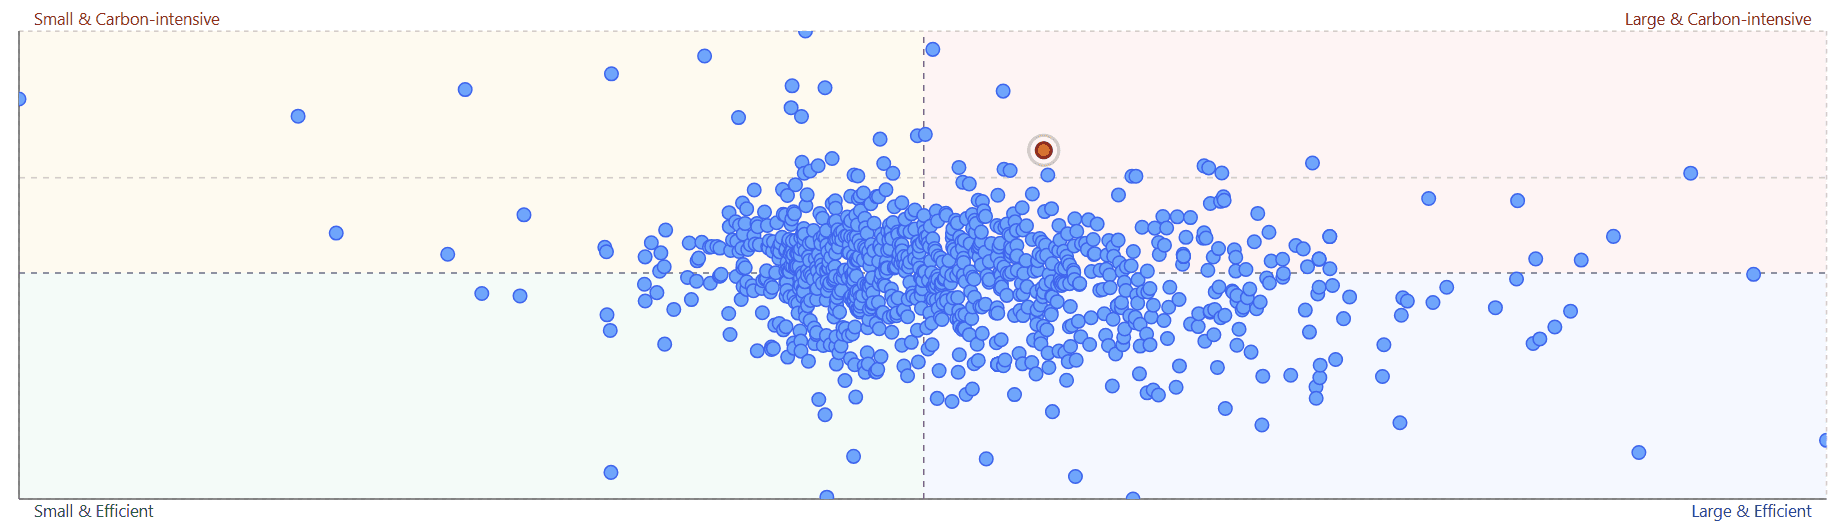
Competitive position
Benchmark range & leaders
Understand where you sit between laggards and leaders, with clear bands that show where you are in the pack.
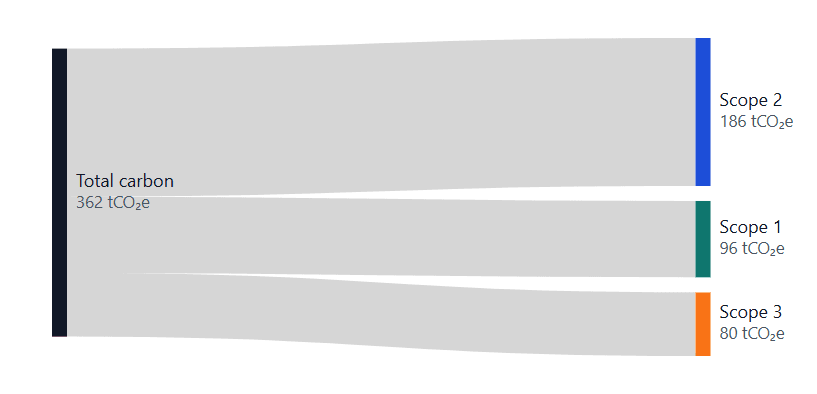
Where emissions come from
Scope & source breakdown
See which parts of your business are driving your footprint and where action will matter most.
Progress over time
Key metrics & trajectory
Track emissions, intensity and reduction pace over time against government targets.

Market insight
Competitive Intelligence
View competitor carbon emissions and plot their performance against your own.
Bespoke analysis
More than just a dashboard.
Need tailored carbon statistics for your use cases? All customers can request bespoke data and analysis for free, to maximise the value of one of the UK's most comprehensive carbon datasets.
Consultant membership
Large portfolios
Benchmark, track and produce reports for all your customers in one place with our consultant membership.

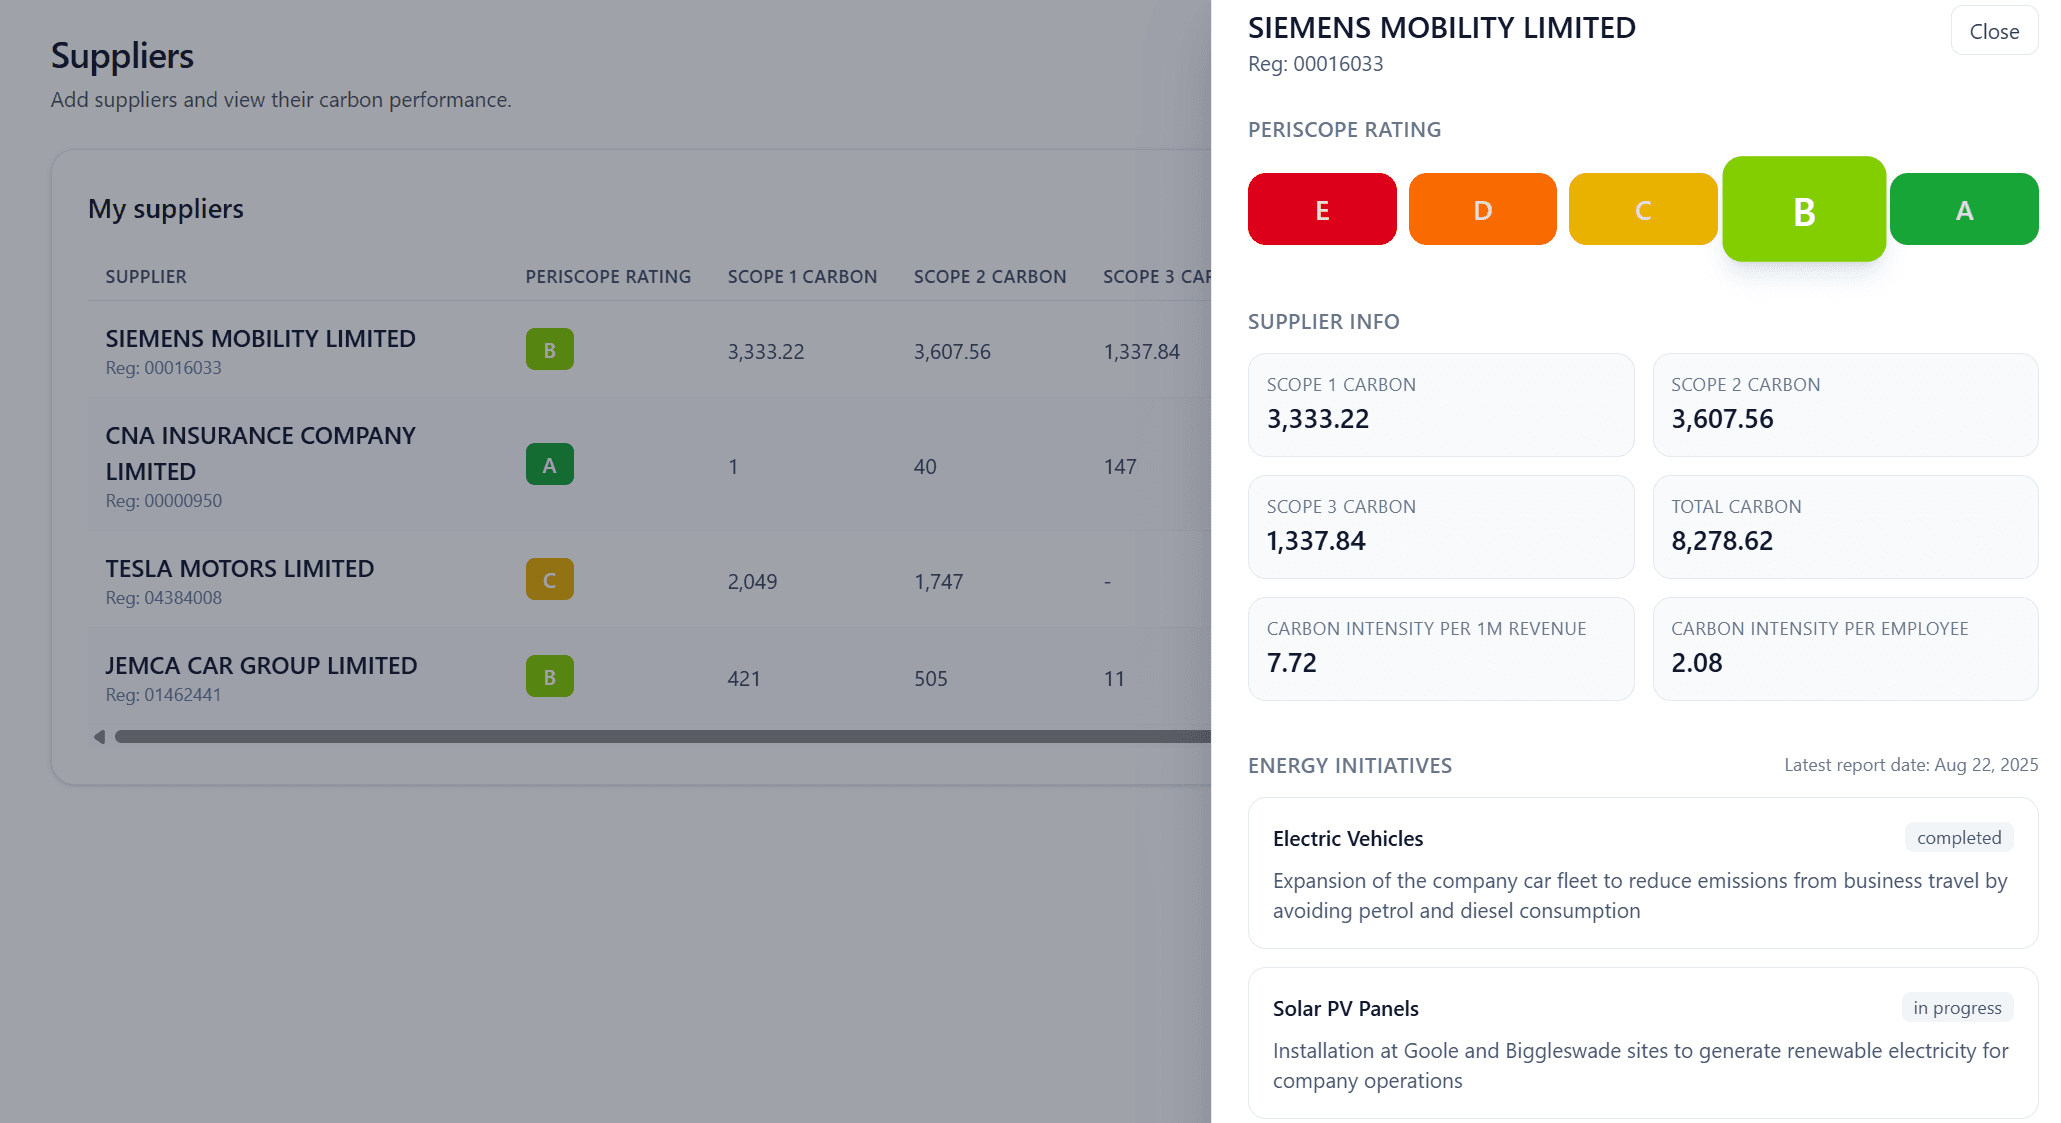
Supply chain insight
Suppliers
View your suppliers' carbon performance and climate initiatives to ensure they align with your company.
How Periscope.eco works
Simple inputs, powerful benchmarking. Go from raw data to a live view of your competitive position in days, not months.
Join for free
Sign up now and get started in a matter of minutes by confirming your emissions data.
Get your health score & benchmarks
See your carbon health score, where you sit vs peers and leaders, and how your trajectory compares to the wider market.
Share board and tender-ready outputs
Export charts and share reports that clearly show where you stand today and what needs to happen next.
Try Periscope.eco